The US Treasury Buyback Program
Systemic support for the US Govt debt markets

With help from Grok
Schedule of Treasury Buyback Operations
Overview of the US Treasury Buyback Program
The program outlined in the linked PDF above (tentative schedule for August–November 2025) focuses on liquidity support buybacks, targeting off-the-run nominal coupon securities and Treasury Inflation-Protected Securities (TIPS) across maturity buckets from 1 month to 30 years. Operations occur 1–2 times weekly, with maximum purchase amounts ranging from $500 million (for longer TIPS) to $4 billion (shorter nominals). The explicit goal is to provide a predictable outlet for dealers to offload these less liquid securities, enhancing overall Treasury market functioning. This directly counters the notion that “no one wants off-the-run securities”—the program is designed precisely to create demand for them, as primary dealers (who hold ~70% of off-the-run inventory) actively participate to manage balance sheet constraints and holding costs.
While liquidity improvement is the headline objective, evidence from Treasury announcements, academic studies, and market analyses shows the program has broader effects on pricing, supply dynamics, dealer behaviour, and borrowing costs. These ripple through the economy, potentially lowering taxpayer expenses and stabilising broader financial conditions.
Core Effects Beyond Pure Liquidity
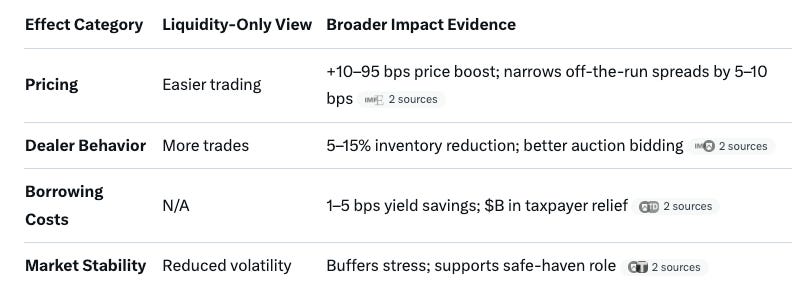
Liquidity support buybacks go further than just facilitating trades; they influence market structure and economics in measurable ways:
Price Support and Yield Compression for Targeted Securities:
Buybacks create predictable demand, which raises prices (and lowers yields) for listed and purchased off-the-run securities. An IMF study analysing the program’s early operations (2024–2025) found that inclusion in a buyback moderately narrows bid-ask spreads (by 5–10 basis points on average) and boosts prices by 10–20 basis points for eligible CUSIPs, with even stronger effects (30 basis points) for those actually bought.
This isn’t trivial: During the 2000–2002 buyback program (a precursor), reductions in off-the-run supply contributed 95 basis points to yield compression across bought-back and similar-maturity bonds, per a Journal of Banking & Finance analysis. The current program, though smaller ($30 billion quarterly), shows similar “local supply” spillovers, where fewer off-the-runs available tightens pricing for substitutes.
Economic tie-in: Lower yields on off-the-runs reduce the “liquidity premium” (the extra yield investors demand for illiquid bonds), making the overall Treasury curve more efficient and indirectly supporting corporate bond pricing.
Dealer Balance Sheet Relief and Inventory Management:
Dealers reduce net holdings of Treasury bills and coupons post-buyback, especially when inventories are high (e.g., during auction peaks or month-ends). The same IMF analysis quantified this: Buybacks cut primary dealer off-the-run positions by 5–15% in affected buckets, easing regulatory pressures like the Supplementary Leverage Ratio (SLR).
This encourages more aggressive market-making, as dealers can rotate inventory without fire-sale risks. Treasury Borrowing Advisory Committee (TBAC) feedback (Q1 2025) notes the program “provides outlets for off-the-run inventory” and has a “moderate” but positive impact on intermediation capacity—dealers report better willingness to bid at auctions knowing buybacks are scheduled.
Debt Management and Cost Savings:
By retiring higher-yielding off-the-runs (often bought at discounts), Treasury effectively refinances debt at lower rates when reissuing on-the-runs or bills. This lowers long-term borrowing costs for the government—estimated at 1–5 basis points per operation in historical data—translating to billions in taxpayer savings over time.
It also smooths the maturity profile without meaningfully shifting the weighted average maturity (WAM) of outstanding debt. For cash management variants (overlapping in the 1M–2Y bucket), it tempers bill issuance volatility, avoiding supply shocks that could spike short-term rates.
Market Stability and Broader Spillovers:
In volatile periods (e.g., 2025 tariff shocks), buybacks act as a buffer, maintaining Treasury’s “safe-haven” status and reducing risk premiums. A Q2 2025 TBAC report highlighted how they “support liquidity and cash management” amid rising dealer inventories, preventing liquidity spirals.
Indirect effects include stabilised equities and even crypto (e.g., XRP analyses note improved macro liquidity from buybacks). The Fed’s System Open Market Account (SOMA) portfolio adjusts subtly—avoiding over-concentration in bought-back bonds—to prevent exacerbating supply shortages.
Addressing “No One Wants Off-the-Run Securities”
This is a common misconception, but data debunks it:
Demand exists, but it’s constrained: Off-the-runs trade at wider spreads (~20–50 bps more than on-the-runs) due to lower trading volume, but buybacks provide a “regular and predictable” buyer (Treasury itself). Offer-to-max ratios in recent operations hit 80–100% in longer buckets, showing strong dealer interest—far from unwanted.
Historical precedent: The 2000–2002 program successfully reduced off-the-run float by ~20%, propping up benchmark liquidity without collapsing secondary markets.
Exclusions ensure focus: On-the-runs and low-float securities (<$5–10 billion) are skipped to avoid distorting high-demand areas.